Loading...
Reliable tornado data sourced from official organizations:


Loading...
Reliable tornado data sourced from official organizations:
The Outlook tab shows you where severe weather is most likely over the next 3 days. Here's how to make sense of it.
The Storm Prediction Center (SPC) is a team of meteorologists in Norman, Oklahoma who forecast severe weather for the entire United States.
Each morning (and multiple times throughout the day), they issue outlooks — maps showing where severe weather is most likely. These outlooks are what you see in the Outlook tab.
Day 1 = Today
The most accurate forecast. Shaded areas are smaller and more precise. If your area is highlighted, pay close attention today.
Day 2 = Tomorrow
Good forecast but less precise. Areas tend to be larger because there's more uncertainty about exactly where storms will develop.
Day 3 = Day After Tomorrow
A general outlook. Large areas may be highlighted. Useful for knowing "severe weather is possible in my region" but details will sharpen as the day gets closer.
The Categorical (Severe) outlook uses a 5-level scale from Marginal to High. Each level corresponds to a color on the map:
TSTM — General Thunderstorms
Thunderstorms are possible, but severe weather is NOT expected. Lightning and heavy rain are the main concerns.
MRGL — Marginal Risk (Level 1)
Isolated severe storms are possible, but confidence is low. A brief tornado or small hail are possible but unlikely.
SLGT — Slight Risk (Level 2)
Scattered severe storms are expected. Time to start paying attention. Damaging winds, hail, and possibly a tornado or two.
ENH — Enhanced Risk (Level 3)
Numerous severe storms are likely. Have a plan and be ready to act. Multiple tornadoes, large hail, or widespread damaging winds possible.
MDT — Moderate Risk (Level 4)
Widespread severe weather expected. This is serious. Strong tornadoes, very large hail, and destructive winds are likely.
HIGH — High Risk (Level 5)
A rare, particularly dangerous situation. Only issued a few times per year. Major tornado outbreak or extreme destructive event expected.
If you see Moderate or High risk over your area, that is NOT a normal day. Take it very seriously — have your shelter plan ready and stay alert all day.
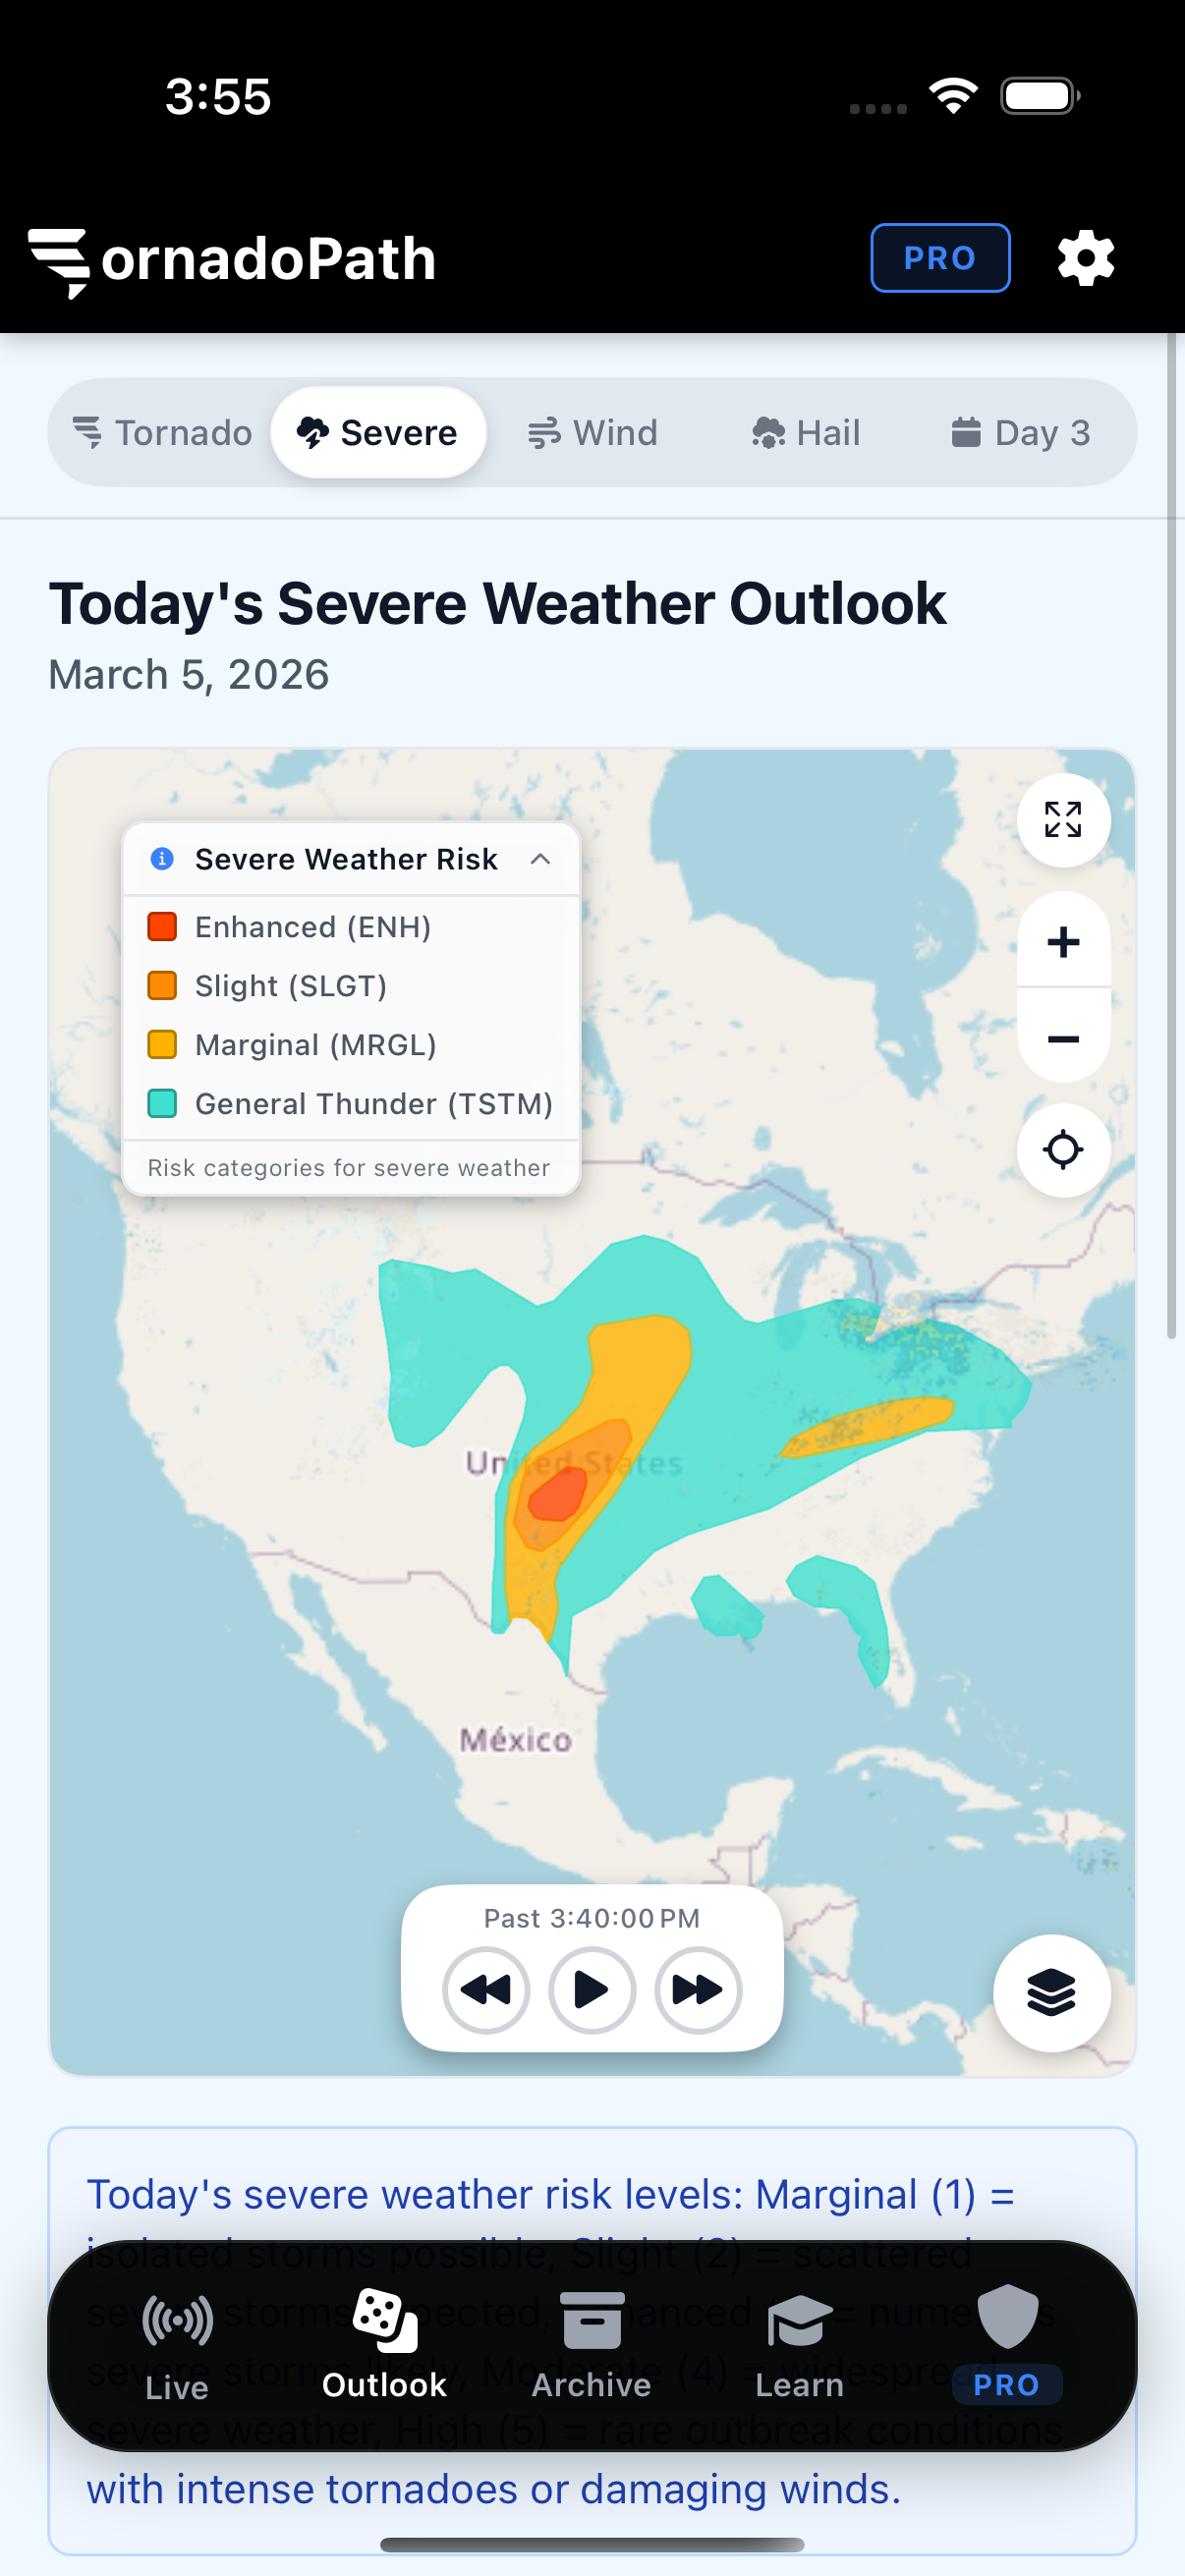
The Outlook tab showing today's Severe Weather outlook. You can see Enhanced (orange-red), Slight (dark orange), Marginal (amber), and General Thunderstorm (turquoise) areas — with the risk legend in the top left.
In the Outlook tab, you'll see 5 sub-tabs. Each shows a different type of severe weather risk:
Tornado
How likely tornadoes are specifically. Shown as probability percentages.
Severe (Categorical)
The overall severe weather risk — all hazards combined into one risk level (Marginal through High).
Wind
Specifically the risk of damaging winds (58+ mph). Shown as probability percentages.
Hail
The risk of large hail (1"+ diameter). Shown as probability percentages.
Day 3
A look ahead to the day after tomorrow. Combines tornado, wind, and hail risk into one single map.
On the tornado, wind, and hail outlook maps, you'll see percentages like 2%, 5%, 10%, 15%, etc.
"10% tornado probability" does NOT mean a 10% chance a tornado hits your house. It means there's a 10% chance of a tornado occurring within 25 miles of any given point in the shaded area.
That might sound small, but on a typical day, the probability is essentially 0%. So even 5% is 5 times the normal odds. Here's a rough guide:
2%
Low but not zero. A tornado is possible but unlikely.
5%
Notable. There's a real chance. Stay aware.
10–15%
Significant. Multiple tornadoes likely in the area. Have your plan ready.
30%+
Exceptionally high. This is outbreak territory. Treat this day with extreme caution.
Percentages tell you how likely storms are. Conditional Intensity Groups (CIGs) tell you how strong those storms could be if they actually form.
CIG 1 — Low (Significant Severe)
Tornadoes/Wind: EF0–EF1 tornadoes or lower-end damaging wind events. Hail: 2" diameter (hen egg size).
CIG 2 — Moderate-Severe
Tornadoes/Wind: Greater destructive potential — EF2+ tornadoes possible. Hail: 3.5"+ diameter (baseball size).
CIG 3 — High-End/Violent
Tornadoes/Wind: Rare, historic outbreak-level intensity — violent (EF4+) tornadoes or widespread severe winds (derechos). Hail: Extreme, destructive hail.
Imagine two days that both have a 15% chance of severe weather. One day, if storms form, they might just be gusty and brief (CIG 1). The other day, if storms develop, they could produce violent tornadoes and baseball-sized hail (CIG 3). The CIG system explains that difference.
If you see CIG 3 over your area, this is an extremely rare and dangerous situation. Have your shelter plan ready and be prepared to act immediately.
When reading an outlook, look at both numbers:
The percentage = How likely storms are
The CIG hatching = How strong those storms could be
Together, they paint a much clearer picture of what to expect.
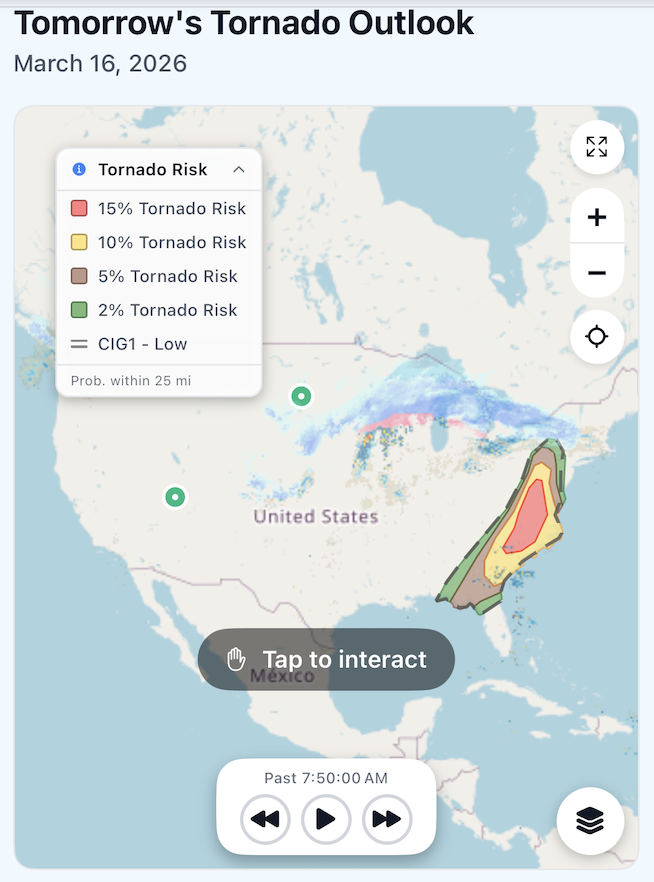
The three CIG hatching styles as shown on SPC outlook maps. In the app, CIG areas are displayed as dashed outlines with labels in the map legend.
View Today's Live Outlooks
See the latest SPC tornado, severe weather, wind, and hail outlook maps — updated multiple times daily.